ANALYTIC EDGE

A mixed marketing management tool providing technology-enabled analytics solutions in marketing & sales effectiveness.

Experience Strategy

Experience Strategy

Experience Strategy

CLIENT

ANALYTIC EDGE

INDUSTRY

SaaS

PROJECT TYPE

B2B, Management Tool

Designed a SaaS product for tracking marketing performance and optimizing project analytics.

01 // THE BRIEF

Design an intuitive and powerful SaaS product that analyses marketing data and enables users to monitor performance metrics and compare results across various projects. It should provide a comprehensive overview and facilitate better decision-making for future planning.

02 // SERVICES OFFERED

UX Strategy

Experience Strategy

Experience Strategy

Design

Research

Research

Usability Testing

Experience Strategy

Experience Strategy

03 // THE APPROACH

We prioritised a user centric and guided process which mainly focussed on understanding user journey in detail and making it as simple as possible. Through iterative design, the platform was continuously refined based on user feedback and business needs. This approach ensured a balance between complexity and usability for diverse users.

User journey, Technical concepts

Define

User journey, Technical concepts

Define

User journey, Technical concepts

Define

Free ideation, Affinity mapping

Ideate

Free ideation, Affinity mapping

Ideate

Free ideation, Affinity mapping

Ideate

Information architecture, Design system, Web prototype

Design & Prototype

Information architecture, Design system, Web prototype

Design & Prototype

Information architecture, Design system, Web prototype

Design & Prototype

04 // THE PROBLEM AREAS

Discussions with stakeholders revealed that users struggle with the complexity of data which makes it difficult to derive insights quickly. Additionally, interpreting results is challenging for users without a strong analytical background, emphasizing the need for better data visualization. Integration into existing workflows was also highlighted as a pain point, along with concerns about scalability and adapting to new features as the platform evolves.

Key problem areas:

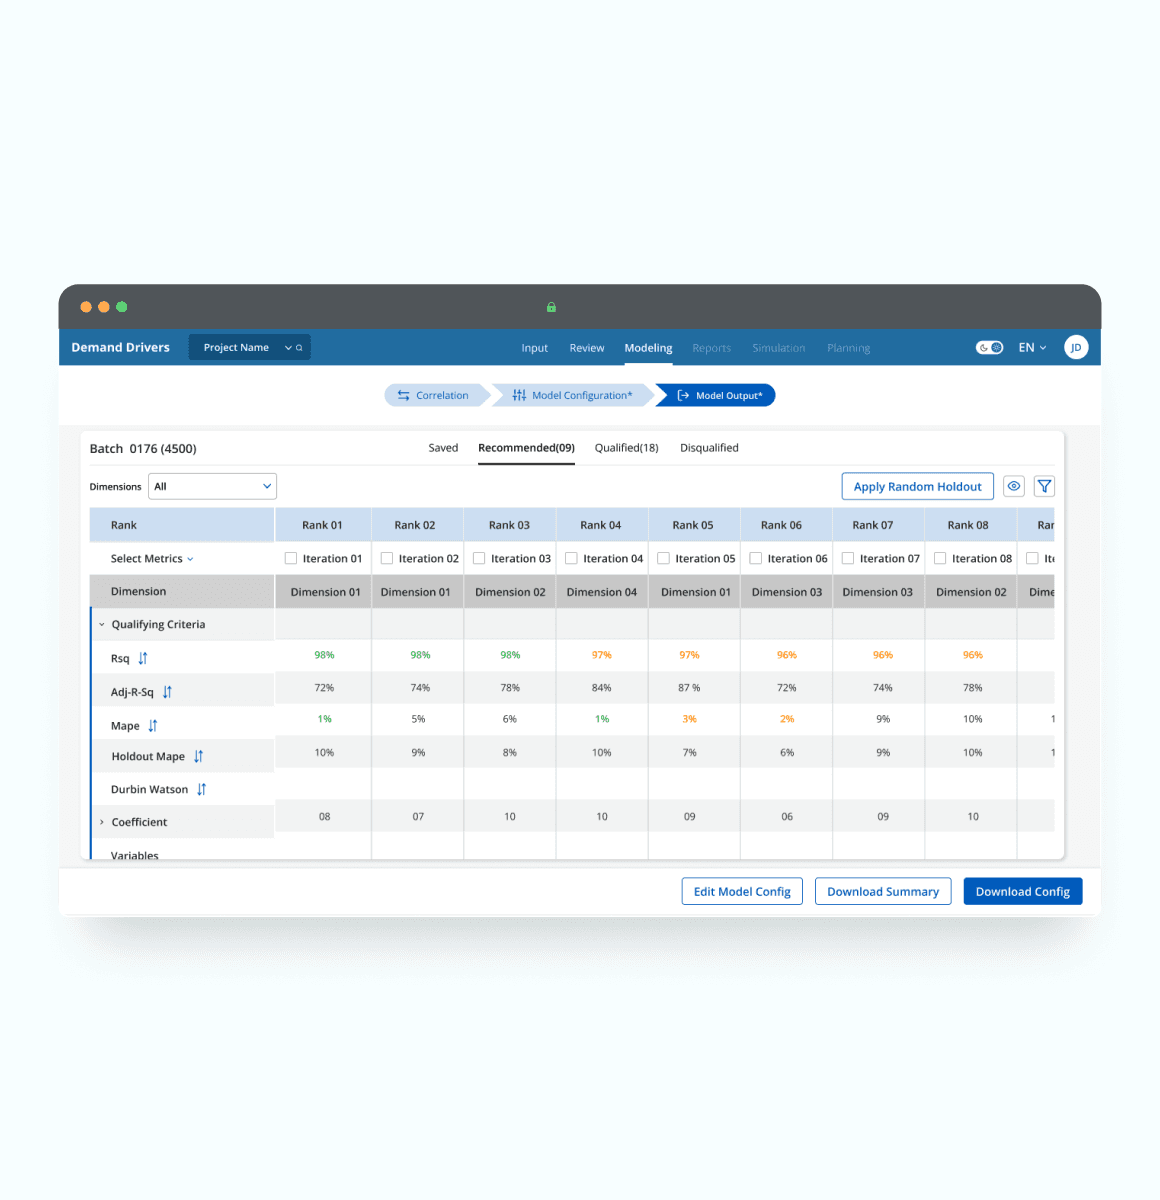
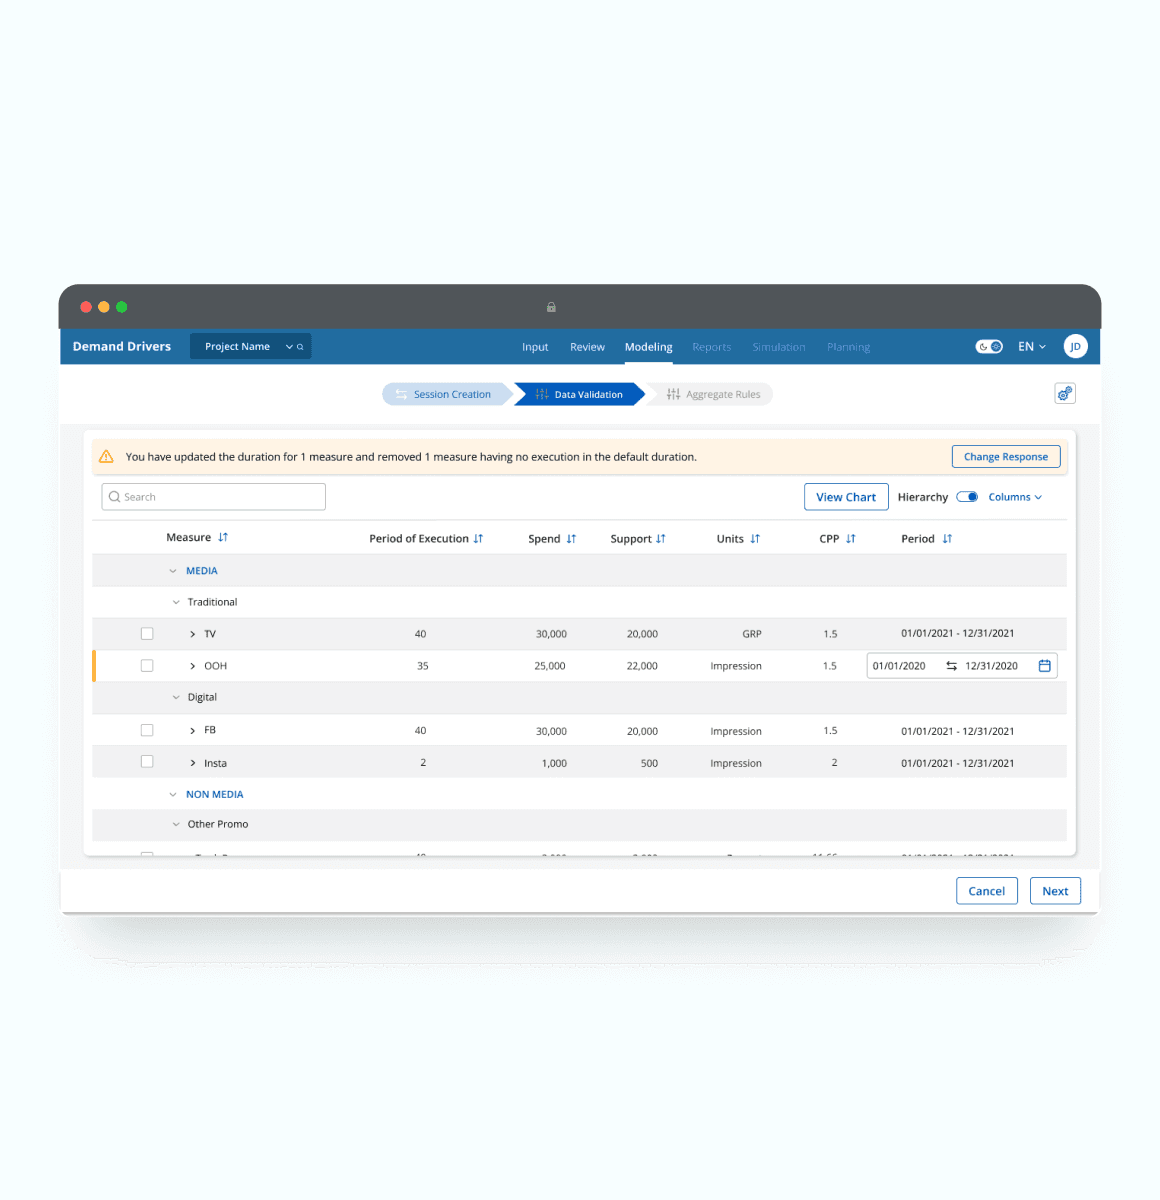
  • Highly technical product

  • Driven by complex datasets

  • Needs a design that reduced cognitive overload

  • Clean data visualisation to eliminate scope of error

05 // THE SOLUTION

An all-in-one mixed marketing management tool that helps the user in strategizing future marketing activities

Simplified design with intuitive user journey

Simplified design with intuitive user journey

Simplified design with intuitive user journey

Role based customisation for users

Role based customisation for users

Role based customisation for users

Guided learning and onboarding

Guided learning and onboarding

Guided learning and onboarding

Data Visualisation

Data Visualisation

Data Visualisation

Scalable design to enable future enhancements and integration of new data points and features

Scalable design to enable future enhancements and integration of new data points and features

Scalable design to enable future enhancements and integration of new data points and features

  • Time Series Analysis Dashboard – Visual representation of data trends with interactive controls.
    Model output charts view

  • Predictive Model Insights – Graphical analysis of variable impact on demand drivers.
    Response curves

  • Model Evaluation and Optimization Dashboard.
    Model output view

  • Data Input and Configuration Panel – Interface displaying structured data with customization options.
    Data validation

  • Time Series Analysis Dashboard – Visual representation of data trends with interactive controls.
  • Predictive Model Insights – Graphical analysis of variable impact on demand drivers.
  • Model Evaluation and Optimization Dashboard.
  • Data Input and Configuration Panel – Interface displaying structured data with customization options.

06 // CLIENT’S RESPONSE

We have been partnering with CX100 since 2021, and their expertise has been invaluable in helping us navigate the complexities of our product. Their deep understanding of design, coupled with a strong advocacy for usability, has significantly enhanced our offering. We highly appreciate their innovative solutions, attention to detail, and commitment to delivering high-quality results. Their collaborative approach makes them a true asset to our team, and we look forward to continuing this successful partnership.

Feedback from Product Manager